
DSE Market Technical Guru
Follow the DSE from 1993 to today: the market's trend and momentum, where the money is moving, and a model that ranks the liquid shares every trading day.
Overview
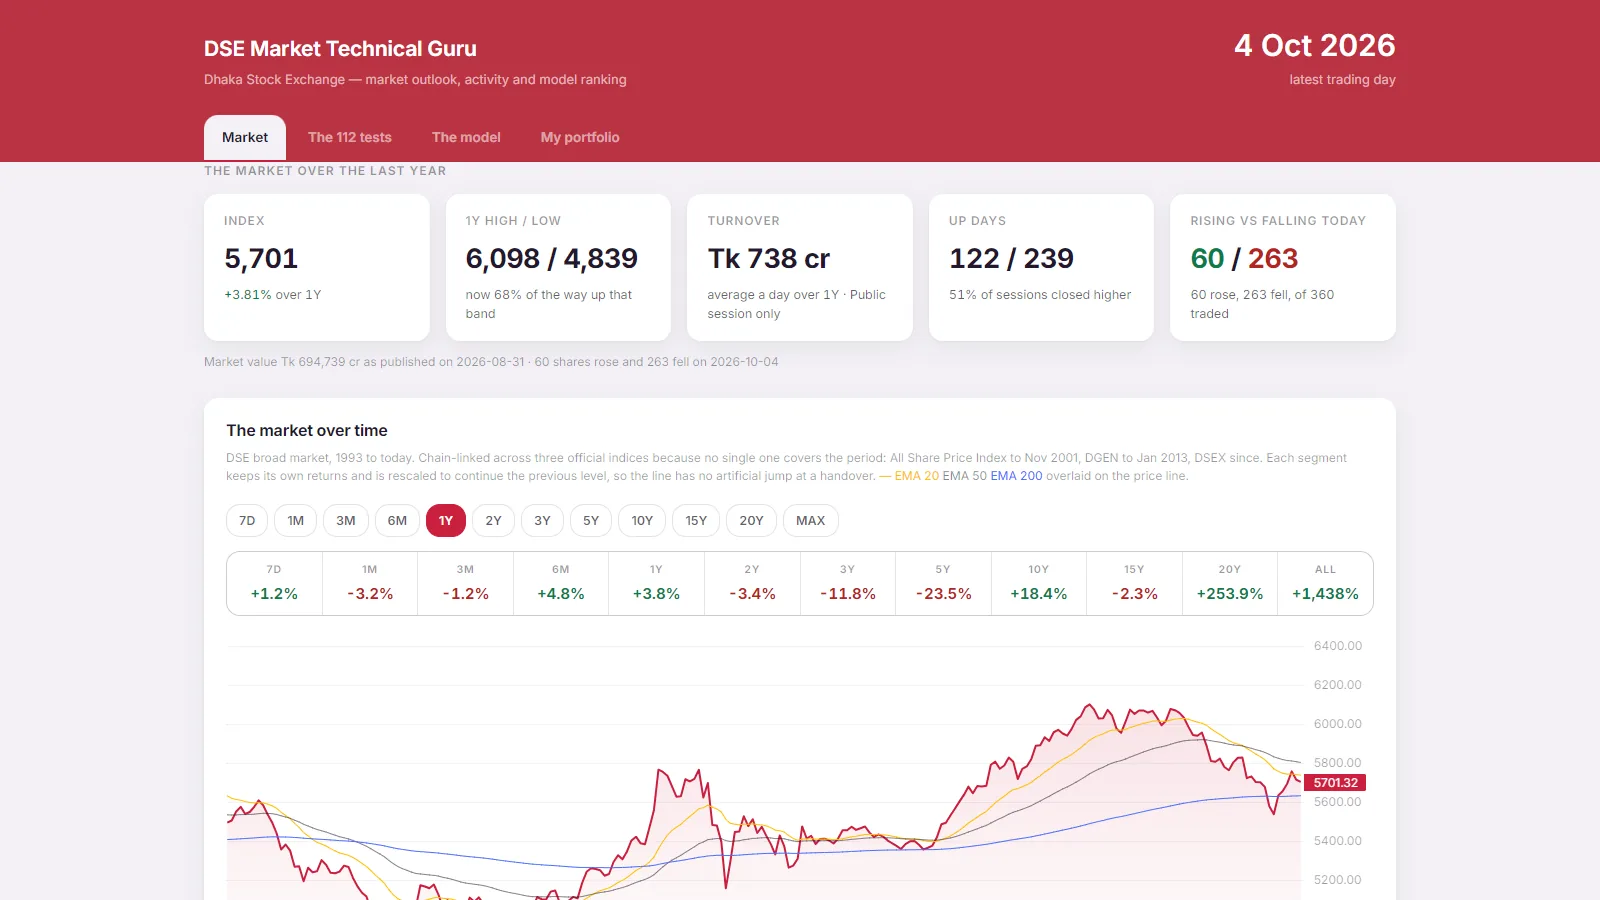
One continuous line of the DSE broad market since 1993, chain-linked across the three official indices so there is no artificial jump at a handover - with EMA 20, 50 and 200, RSI and MACD, and daily turnover from seven days to the full history.
Each trading day the model ranks the liquid universe and says why each share sits where it does. It says which shares look better than others - not whether to buy, when to buy, or what return to expect.
What's inside
The market since 1993
One continuous line across three official indices, with EMA 20, 50 and 200.
Momentum, not just price
RSI and MACD beside the price, from seven days to the full history.
Where the money moves
Daily turnover, sector up and down counts, and the busiest shares.
A daily model ranking
The liquid shares ranked every trading day, each with its reason.
The 112 tests
The tests behind the model, laid out to read.
My portfolio
Sign in to follow your own holdings against the market.
Pricing
Simple plans that scale with you. Cancel anytime.
Starter
For small teams getting started.
- 1 location / workspace
- Up to 3 seats
- Core features
- Email support
Growth
Most popularFor growing businesses that need more.
- Up to 5 locations / workspaces
- Up to 25 seats
- Advanced analytics & AI
- Priority support
- Integrations & API
Enterprise
For scale, security, and bespoke needs.
- Unlimited locations & seats
- SSO & role-based access
- Dedicated success manager
- Custom SLAs & onboarding
Prices shown are placeholders - final pricing to be confirmed.
Other products we've built



Ready to run DSE Market Technical Guru?
Start free in minutes, or book a walkthrough with our team.